


雅思考试的小作文中,图表类型分为两大类:数据图和非数据图,其中数据图又可以分为:静态图和动态图。分类标准就是是否有多个不同时间段:静态图通常只有一个或者没有任何的时间点,而动态图则具有两个以上的时间段。之所以按照动静态图分类是因为不同的图表描述重点不同。比如以下两个图表:表1就是静态图,描述重点是不同数据的大小数值比较,就会用到比大小的相关句型:最值、比较级、倍数关系等;表2是动态图,描述重点则是不同趋势的对比,会用到上升下降等单词和句型表达。
表1:
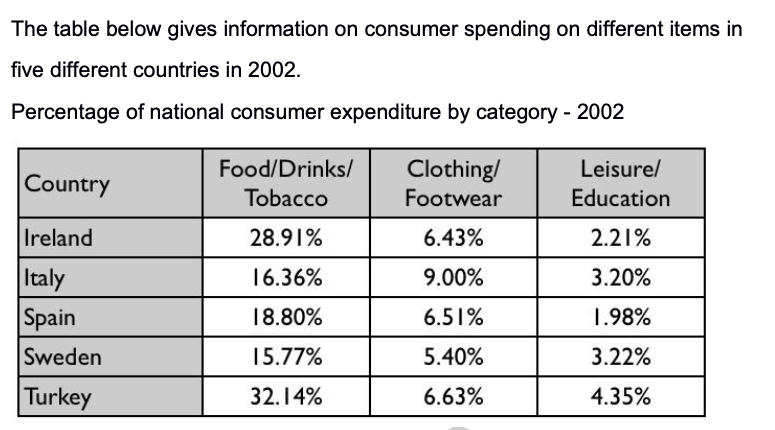
表2:
那么本次先给大家补充一些静态图中比较常用的词句表达以及相应的翻译练习:
最大值:Sth. was the largest / occupied the largest portion / stayed on the peak.
第二大:be the second highest/ biggest/ largest/ greatest
share/enjoy the second most popularity
最小值:Sth. was the smallest / took up the smallest part / was at the bottom.
练习:在一个普通的英国家庭,用于加热房间和水的电量是最多的,占了总电量的 52.5%。
答案:In a common English household, electricity used for heating room and water was the largest, occupying 52.5% of the total.
除了最值之外,图表中的数据还可能会包括相等、相似、倍数关系,可以使用以下句型:
相等关系句型:A is equal / equivalent to B, with _____.
相近关系句型:A is quite close to B, arriving at ___ and ____ respectively.
练习:用于照明和用于电器的电量比例是一样的,均为15%。
答案:The proportion of electricity used for lighting is equal to that for appliances, with 15%.
倍数关系:A is twice / three times as+adj.原级+as B, with ___ and ____ separately.
练习:用于加热的电量是用于电器的电量比例的三倍多,分别为52.5%和15%。
答案:The proportion of electricity used for heating is three times as much as that for appliances, with 52.5% and 15% separately.
接下来是上面表1的范文,大家可以参照标出来的句式学习仿写:
The table shows percentages of consumer expenditure for three categories of products and services in five countries in 2002.
It is clear that the largest proportion of consumer spending in each country went on food, drinks and tobacco. On the other hand, the leisure,education category had the lowest percentages in the table.
Out of the five countries, consumer spending on food, drinks and tobacco was noticeably higher in Turkey, at 32.14%, and Ireland, at nearly 29%. The proportion of spending on leisure and education was also highest in Turkey, at 4.35%, while expenditure on clothing and footwear was significantly higher in Italy, at 9%, than in any of the other countries.
It can be seen that Sweden had the lowest percentages of national consumer expenditure for food/drinks/tobacco and for clothing/footwear, at nearly 16% and just over 5% respectively. Spain had slightly higher figures for these categories, but the lowest figure for leisure/education, at only 1.98%.
看完范文我们会发现,静态图写作并不难,并且大量使用了我们刚才补充过的句型表达,大家回去务必把本次的词汇句型掌握,静态图不难拿分!
 咨询时间:9:00-23:00
 咨询时间:
咨询时间:

留下您的信息和咨询问题,为您定制专属留学规划!


