


上次的文章中给大家分享了关于静态图的几个常用词句表达,本次给大家分享一下动态图的词句表达。首先还是复习一下图表类型的分类标准:静态图通常只有一个或者没有任何的时间点,文章重点是比大小,;而动态图则具有两个以上的时间段,写作重点是比较趋势,比如下图。那么动态图中会大量使用到上升、下降、达到峰值等的相关描述,本次就给大家补充一下动态图的词句表达。
那么接下来就给大家补充一些动态图中比较常用的词句表达以及相应的翻译练习:
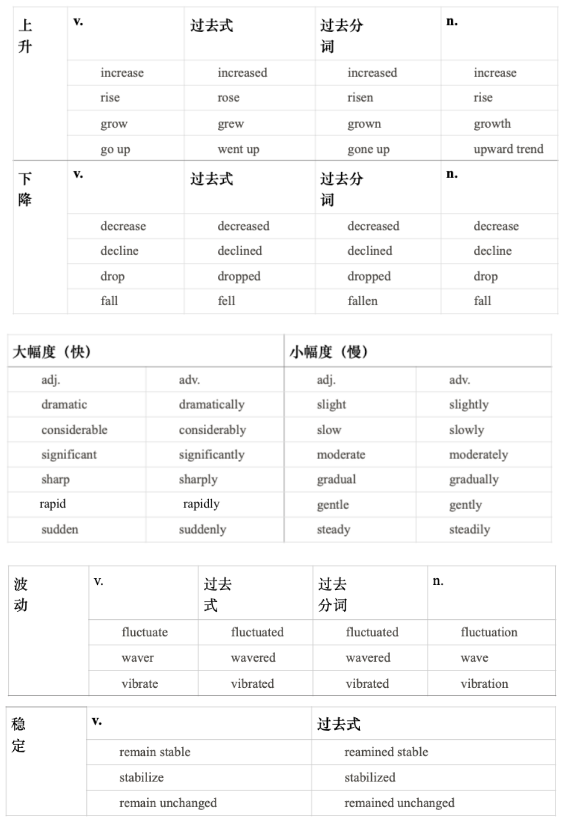
以上是动态图描述中常用的单词和变化形式,那么接下来是一些再动态图中会用来表示上升或下降的常用句型和练习:
主谓结构:描述内容 + 动词(表示趋势)+ 副词(表示幅度)
例:The number/ figure/ proportion/ percentage of students increased sharply from 100 in 1991 to 700 in 1994.
There be 结构: There be+ a+形容词(表示幅度)+ 名词(表示趋势)+in+描述内容
例:There was a sharp increase in the number/ figure/ proportion/ percentage of students from 100 in 1991 to 700 in 1994.
练习:
电量的需求在冬天9点到12点从30,000 units涨到了40,000 units。
Demand for electricity in winter increased from 30,000 units to 40,000 units between 9:00 and 12:00.
电量的需求在冬天在20点后下降到了大约35,000 units。
Demand for electricity in winter decreased to nearly 35,000 units at 20:00.
电量需求在冬天14点到16点间保持稳定,在20点后急速下降。
Demand for electricity in winter remained unchanged from 14:00 to 16:00 and sharply dropped after 20:00.
夏季的电量需求在17点到21点有轻微波动。
Demand for electricity in summer fluctuated slightly from 17:00 to 21:00.
最值的描述:
达到最大值:reach the peak/ top/ highest point at
达到最小值: reach the bottom/lowest point at
drop to the bottom/lowest point at
练习:
冬季的电量需求在22点达到了顶峰,大约45,000 units。
Demand for electricity in winter reached the peak at about 45,000 units at 22:00.
夏季的电量需求在9点降到了最低点,大约低于13,000 units。
Demand of electricity in summer decreased to the bottom just under 13,000 units at 9 o’clock.
以下是上文图表的范文,请大家阅读全文,参照标出来的句式学习仿写:
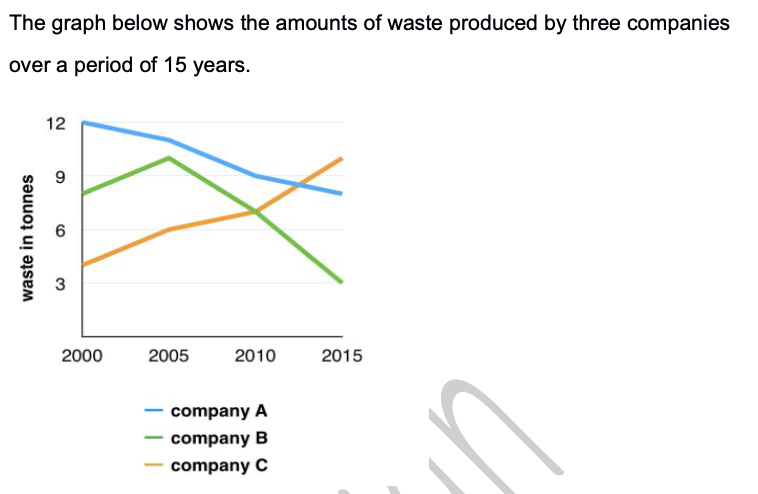
The line graph compares three companies in terms of their waste output between the years 2000 and 2015.
It is clear that there were significant changes in the amounts of waste produced by all three companies shown on the graph. While companies A and B saw waste output fall over the 15-year period, the amount of waste produced by company C increased considerably.
In 2000, company A produced 12 tonnes of waste, while companies B and C produced around 8 tonnes and 4 tonnes of waste material respectively. Over the following 5 years, the waste output of companies B and C rose by around 2 tonnes, but the figure for company A fell by approximately 1 tonne.
From 2005 to 2015, company A cut waste production by roughly 3 tonnes, and company B reduced its waste by around 7 tonnes. By contrast, company C saw an increase in waste production of approximately 4 tonnes over the same 10-year period. By 2015, company C’s waste output had risen to 10 tonnes, while the respective amounts of waste from companies A and B had dropped to 8 tonnes and only 3 tonnes.
那么本次分享就到此为止,大多数同学觉得数据图表难的原因在于以前很少接触,希望大家回去之后多看一些往年的数据图考题,并且背诵我们这两次补充的相关词句表达,会帮助大家有效学习!
 咨询时间:9:00-23:00
 咨询时间:
咨询时间:

留下您的信息和咨询问题,为您定制专属留学规划!


